


Volume Profile Trading Guide for Day and Swing Traders Using POC VAH and Order Blocks
Most moving averages answer a late question: where has price already been? Volume Profile answers a better one: where did the market actually do business?
That difference matters for active day and swing traders. A 20-period moving average can help define trend, but it cannot show where large two-way trade occurred, where price was accepted, or where a market may react when it revisits a prior institutional zone. Volume Profile gives that structure.
Instead of plotting volume by time, Volume Profile plots volume by price. It turns a chart into an auction map. The thick parts show prices where buyers and sellers agreed. The thin parts show prices where the market moved quickly because one side was more urgent.
This Volume profile trading strategy tutorial explains how to read the key levels, how to combine them with order blocks, and how to build a simple plan for day trades and swing trades. This is educational content only, not financial advice.

Volume Profile shows the auction behind the candles
A normal volume indicator shows how much volume traded during each candle. That is useful, but it hides the most important part: the exact prices where that volume traded.
Volume Profile rotates the idea. It places volume on the vertical price axis.
If GBP/USD trades heavily around 1.2700, the profile will show a wide horizontal bar at that price. If price slices through 1.2670 with very little trade, that area will appear thin.
This creates three useful concepts:
Acceptance Price spends time and volume in an area. The market agrees that this region is fair, at least for now.
Rejection Price moves away quickly from an area. The market finds little interest there.
Migration The high-volume area shifts higher or lower. Value is being re-priced.
Traditional lagging indicators smooth price. Volume Profile keeps market structure visible. A moving average may tell you price is above its average. Volume Profile can tell you whether price is trading above accepted value, inside accepted value, or rejecting a previous high-volume zone.
That is a different level of information.
The main types of Volume Profile
Most trading platforms offer several versions. They are built from the same idea, but each answers a different question.
Profile type | Best use | Main question it answers |
Session Volume Profile | Intraday trading | Where did today’s market accept value? |
Fixed Range Volume Profile | Event or swing analysis | Where did volume build during this specific move? |
Visible Range Volume Profile | Quick chart context | Where is volume concentrated on the visible chart? |
Composite Volume Profile | Higher-timeframe planning | Where are the major long-term acceptance zones? |
For day trading, a session profile is usually the starting point. For swing trading, fixed range and composite profiles are often more useful because they show the auction across several sessions or an entire trend leg.
The key Volume Profile levels every trader must understand
Volume Profile can look complex at first. The good news is that three levels carry most of the practical value: Point of Control, Value Area High, and High-Volume Nodes.
Point of Control means the most traded price
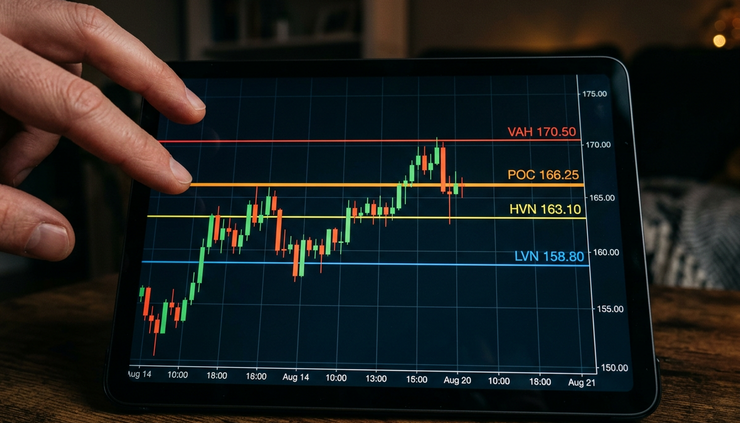
The Point of Control, often marked as `POC`, is the price level with the highest traded volume inside the selected profile.
Think of it as the fairest price in that sample. It is where the market spent the most energy. Buyers and sellers both found enough interest to transact heavily.
In practical terms, the POC can act as:
A magnet when price is rotating
A support or resistance area when retested
A line that separates bullish acceptance from bearish acceptance
A reference point for trade location
If price is above the POC and holding, buyers are accepting higher prices. If price is below the POC and failing to reclaim it, sellers may still control the auction.
In point of control day trading, the key is not to buy or sell the POC blindly. Watch how price behaves around it. A clean reclaim, a failed auction, or a sharp rejection gives more information than the level alone.
Value Area High marks the upper edge of accepted value
The Value Area is the range that contains the bulk of traded volume in the selected profile. Many platforms use around 70% by default, though the exact setting can vary.
The Value Area High, or `VAH`, is the upper boundary of that accepted range.
VAH matters because it often acts as a decision point.
When price trades above VAH and holds, the market may be accepting higher value. That can lead to continuation. When price pushes above VAH and quickly falls back inside value, the move may be a failed breakout.
A simple interpretation:
Price above VAH and holding Buyers are accepting higher prices.
Price above VAH and rejecting The market tested unfair high prices and came back into value.
Price inside value Rotation is more likely than trend expansion.
Price below value after rejecting VAH Sellers may target the POC or lower value boundary.
Although this guide focuses on VAH, many traders also track `VAL`, the Value Area Low. Together, VAH and VAL frame the accepted auction range.
High-Volume Nodes show heavy agreement
A High-Volume Node, or `HVN`, is a thick area on the profile where a large amount of volume traded.
HVNs often behave like balance zones. Price may slow down there because the market previously agreed on value. They can act like sticky areas, especially during low-volatility sessions.
A High-Volume Node can be useful for:
Identifying likely consolidation zones
Avoiding poor entries in the middle of balance
Setting realistic first targets
Understanding why price slows after a strong move
The opposite is a Low-Volume Node, or `LVN`. These are thin areas on the profile. Price often moves faster through LVNs because there was little previous agreement there.
If an HVN is a town centre, an LVN is an empty road between towns.
Why Volume Profile is often better than lagging moving indicators
Moving averages are not useless. They can help define trend direction and reduce noise. The problem starts when traders use them as decision engines.
A moving average calculates past price. It cannot show:
Where the largest volume actually traded
Whether price is accepted or rejected
Where trapped traders may sit
Where institutional orders may still matter
Whether a breakout occurred from value or from a weak area
Volume Profile gives context that moving averages cannot provide.
For example, price may trade above a 50-period moving average and seem bullish. Yet if it is running straight into a weekly HVN and rejecting above VAH, the long entry may be poor. The trend filter says buy. The auction says price is testing expensive territory.
The reverse can also happen. Price may trade below a moving average, but it may be reclaiming a prior POC from an institutional demand zone. That reclaim can mark a stronger long setup than the moving average suggests.
The point is not to remove every indicator. The point is to stop letting lagging tools decide entries without auction context.
A cleaner hierarchy looks like this:
Higher-timeframe market structure
Volume Profile value levels
Institutional order blocks
Lower-timeframe confirmation
Risk and target placement
This puts price, volume, and liquidity ahead of smoothed averages.
Institutional order blocks become clearer with Volume Profile
An institutional order block is a price zone where large participants likely initiated or defended a position before an impulsive move. In common price action terms, it is often the final bearish candle before a strong bullish displacement, or the final bullish candle before a strong bearish displacement.
Order blocks matter because large orders rarely fill all at once. If price returns to the zone, unfilled interest may still exist.
Yet many traders draw order blocks too broadly. They mark every large candle and expect a reaction. Volume Profile helps filter the better zones.
A high-quality bullish order block often has these features:
It forms before a clear displacement higher
It leaves imbalance or inefficient price movement
It aligns with higher-timeframe structure
It sits near a POC, HVN, VAH retest, or LVN edge
It has clear invalidation below the origin of the move
A weaker order block often sits in the middle of noisy balance with no clear volume reference.
This is where how to read institutional order block content becomes more useful when paired with advanced price action mechanics. The profile tells you whether the block formed inside accepted value, at the edge of value, or in a low-volume rejection area.
That distinction changes the trade.
Order block inside an HVN
An order block inside a High-Volume Node can still work, but price may chop because the market previously accepted that area. Entries need patience.
Best use:
Mean reversion setups
Partial targets near the opposite side of the HVN
Confirmation before entry
Order block at VAH
A bearish order block near VAH can be powerful if price fails to accept above value. The setup becomes a failed auction.
Best use:
Short after rejection back inside value
Stop above the failed auction high
Target POC first, then VAL if selling continues
Order block near an LVN edge
An order block near an LVN can create fast movement if price rejects there. These areas can offer strong reward-to-risk, but they need precise execution.
Best use:
Break-and-retest trades
Continuation entries after displacement
Tight invalidation beyond the order block

A simple framework for planning entries with Volume Profile and order blocks
The goal is not to predict every tick. The goal is to build a repeatable plan before price reaches the trade area.
Use this framework for both day and swing trading. Change only the timeframe.
Step 1. Mark higher-timeframe value
Start with the higher timeframe.
For day trades, look at the prior session, current session, and possibly the weekly profile.
For swing trades, use a fixed range profile across the last major impulse or consolidation.
Mark:
POC
VAH
VAL
Major HVNs
Major LVNs
Ask one question: where is value accepted?
If price is inside value, expect rotation unless displacement proves otherwise. If price is outside value, watch whether it accepts the new area or rejects back inside.
Step 2. Identify the current auction state
There are three common states.
Auction state | Behaviour | Trading implication |
Balance | Price rotates around POC and HVNs | Fade extremes, avoid chasing the middle |
Breakout attempt | Price pushes beyond VAH or VAL | Wait for acceptance or failure |
Trend expansion | Value migrates higher or lower | Trade pullbacks towards value edges or order blocks |
This step prevents a common mistake: using a breakout strategy inside balance, or using a mean-reversion strategy during expansion.
Step 3. Draw only meaningful order blocks
Do not mark every candle. Focus on zones that caused displacement.
A useful order block should show:
A clear origin of the move
Strong departure from the zone
Broken structure or swept liquidity
Reasonable size for risk control
Confluence with Volume Profile
If the block is too wide, refine it using the candle body, lower-timeframe structure, or the volume node inside the zone.
Step 4. Wait for price to return to the planned area
Good trading often feels slow. The plan forms before entry.
For a long setup, the ideal sequence may look like this:
Price breaks above VAH with strong displacement.
The POC starts to migrate higher on the session profile.
Price pulls back into a bullish order block near prior VAH.
The pullback holds above the old value area.
Lower-timeframe candles show absorption or rejection.
Entry triggers on a reclaim or break of minor structure.
For a short setup, invert the logic:
Price rejects above VAH.
It falls back inside value.
A bearish order block forms near the failed high.
Price retests that block and cannot reclaim the high.
Entry triggers after lower-timeframe structure breaks down.
POC becomes the first target.
The strongest trades usually combine location and reaction. Location comes from Volume Profile and order blocks. Reaction comes from price behaviour at the zone.
Step 5. Place invalidation where the idea is wrong
A stop-loss should not sit at a random number of points. It should sit where the trade thesis fails.
For a bullish order block near VAH, the idea fails if price breaks below the order block and accepts back inside lower value.
For a bearish rejection above VAH, the idea fails if price reclaims the failed high and starts accepting above value.
Useful invalidation points include:
Beyond the order block extreme
Beyond the failed auction high or low
Beyond an LVN edge if price should not accept there
Beyond the structural swing that created the setup
This keeps risk tied to market logic.
Step 6. Use profile levels for targets
Targets should also come from structure, not hope.
Common Volume Profile targets include:
POC as the first target after rejection from VAH or VAL
Opposite side of value after a failed auction
Next HVN during continuation
LVN edge if price is moving through a low-volume pocket
Prior session high or low if liquidity is nearby
For example, if price rejects above VAH and falls back inside value, the POC is often the first logical target. If selling continues through the POC, VAL may become the next target.
For swing trades, use composite HVNs as profit zones. Price often pauses there because many older positions were built around those levels.

Common mistakes when trading Volume Profile
Volume Profile is powerful, but it can create false confidence if used poorly.
The first mistake is changing the profile range until the chart looks perfect. Pick a logical range first, then read the data. For a session trade, use a session profile. For a swing leg, anchor the profile to the start and end of that leg.
The second mistake is treating every POC as automatic support or resistance. A POC is a reference level, not a signal. Price can cut through it when order flow is strong.
The third mistake is entering in the middle of value. This is where reward-to-risk usually weakens. The middle of a high-volume balance area is often noise. Better trades tend to form at value extremes, failed auctions, LVN edges, or clean order-block retests.
The fourth mistake is ignoring time. A level from the prior session may matter for an intraday setup. A composite POC from several months ago may matter for a swing setup. Match the profile to the holding period.
The fifth mistake is using Volume Profile without confirmation. Even a perfect VAH and order block confluence can fail. Wait for evidence, such as rejection wicks, lower-timeframe structure shifts, aggressive displacement, or failed retests.
The practical takeaway
Volume Profile helps traders replace lagging decision-making with auction-based planning. Moving averages smooth past price. Volume Profile shows where the market agreed, where it rejected, and where value may shift next.
The cleanest workflow is simple:
Mark POC, VAH, VAL, HVNs, and LVNs.
Decide whether the market is balancing, breaking out, or expanding.
Find only order blocks that caused real displacement.
Trade at the overlap between value levels and institutional zones.
Use invalidation where the trade idea is proven wrong.
Target the next logical area of accepted volume or liquidity.
The edge is not in drawing more lines. It is in knowing which prices mattered most, then waiting for price to return to them with a clear reaction.



Comments