


Backtesting Trading Strategies A Systematic Guide to Avoid Curve Fitting and Bias
A trading strategy can look brilliant on five cherry-picked charts and still fail the moment real money is involved. Backtesting is the filter between an interesting idea and a tradeable system, but only if it is done with discipline.
Good backtesting answers a practical question: would this strategy have had a positive expectancy under realistic market conditions? That means testing clear rules, using clean data, accounting for costs, and resisting the urge to keep adjusting the system until the past looks perfect.
This guide explains how to backtest trading strategies in a structured way, including manual look-backs, automated testing, the metrics that matter, and the most common traps that distort results.
This article is for education only and is not financial advice. Trading involves risk, including the risk of losing capital.
Start with a testable trading idea
A backtest is only useful when the strategy rules are specific enough for someone else to repeat. Vague ideas such as “buy strong stocks” or “sell when momentum fades” create room for hindsight. The test becomes a memory exercise rather than evidence.
A good strategy definition includes:
Market
The exact instrument or universe, such as FTSE 100 shares, GBP/USD, gold, or Bitcoin.
Timeframe
The chart interval and holding period, such as daily candles with trades held for 5 to 20 sessions.
Entry rule
The precise condition that opens a trade.
Exit rule
The precise condition that closes a trade, including profit exits, stop exits, and time exits.
Risk rule
Position size, maximum risk per trade, and any exposure limits.
Trade direction
Long only, short only, or both.
Execution assumption
Whether trades enter at the next open, next close, limit price, or stop price.
For example, “buy when the 20-day moving average crosses above the 100-day moving average” is a clear entry condition. “Buy when price looks strong after a pullback” is not.
The same applies to exits. “Sell when the trend weakens” invites guesswork. “Exit when price closes below the 20-day moving average or after 30 trading days, whichever comes first” can be tested.
Before running any test, write the rules in a short strategy specification. If the strategy changes during the backtest, record the change separately. Do not blend old and new versions into one result.
A simple specification might look like this:
Component | Rule |
Market | Liquid UK large-cap shares |
Timeframe | Daily chart |
Direction | Long only |
Entry | Close above 50-day high |
Exit | Close below 20-day low |
Position size | 1% account risk per trade |
Costs | Spread plus commission estimate |
Test period | 10 years, split into in-sample and out-of-sample data |
This step feels basic, but it prevents many later errors. If the rules are not fixed, the backtest can become a search for a flattering story.
Choose the right method for the strategy
There are two main ways to test a strategy: manual look-backs and automated algorithmic backtesting. Both can be useful, but they answer different questions.
Manual look-backs help you understand the behaviour
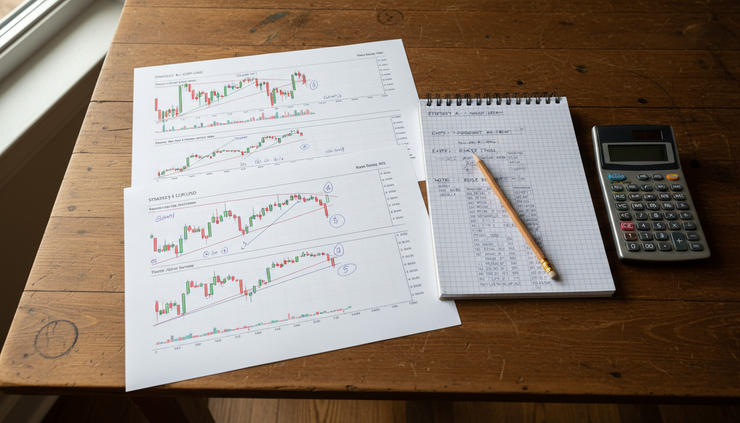
A manual look-back means scrolling through historical charts and marking trades that fit the rules. It is slow, but it builds pattern recognition and highlights practical issues that a spreadsheet may hide.
Manual testing works well when:
The strategy includes some visual judgement.
The trader is still developing the rules.
The goal is to understand trade context.
The sample size does not need to be very large.
The market structure matters, such as gaps, liquidity, or news spikes.
The weakness is bias. It is easy to see what happened next, even when trying not to. The eye naturally gives more weight to clean setups and ignores messy ones. Manual testing also tends to produce small sample sizes, which can make random luck look like skill.
To improve manual tests, move candle by candle, hide future price action where possible, and record every qualifying trade. Do not skip the ugly trades because they “would not have been taken live” unless that filter was written into the rules before the test.
Automated backtesting measures rules at scale
Automated testing uses code or specialist software to apply rules across historical data. It is the standard method for rules-based systems because it can test hundreds or thousands of trades without emotional filtering.
Automated testing works well when:
Entry and exit rules are objective.
The strategy needs a large sample.
Many instruments or time periods must be tested.
Costs, slippage, and position sizing need consistent treatment.
The trader wants to compare variations.
The weakness is false precision. A backtest can produce exact-looking numbers that depend on flawed assumptions. Bad data, unrealistic fills, survivorship bias, or look-ahead logic can all create results that never could have happened in live trading.
The best process often combines both methods. Use manual review to understand how the strategy behaves. Use automated testing to measure it at scale. Then inspect a sample of automated trades manually to check whether the engine is behaving as intended.
This is where many quantitative trading tips, historical data testing, manual vs automated backtesting discussions overlap: the method matters, but the discipline around the method matters more.

Build the backtest like a controlled experiment
A useful backtest separates idea generation from validation. If the same data is used to invent, tune, and approve a strategy, the results are usually too optimistic.
Split the data into clear periods
Use at least two periods:
Period | Purpose | How to use it |
In-sample data | Build and tune the strategy | Test the first version and make limited rule changes |
Out-of-sample data | Validate the strategy | Run once after the rules are fixed |
Forward test | Observe live or demo performance | Confirm execution and behaviour without risking full capital |
The out-of-sample period matters because it acts like unseen data. A strategy does not need to perform identically in both periods, but the broad behaviour should make sense. If the in-sample test shows smooth gains and the out-of-sample test collapses, the model may have learned noise.
A more advanced version is walk-forward testing. The strategy is tuned on one period, tested on the next, then rolled forward. This better reflects the way a live system would be maintained over time.
Include realistic trading costs
Costs can turn a profitable backtest into a losing strategy. Include:
Spread
Commission
Slippage
Stamp duty where relevant for UK share dealing
Financing or overnight costs for leveraged products
Borrow costs for short selling, if applicable
Short-term strategies are especially sensitive to costs. A system that makes many small trades needs very accurate assumptions. If the average trade only earns a small amount before costs, it may not survive real execution.
Use trade timing that could really happen
Many backtests accidentally assume impossible fills. A signal based on the closing price cannot also enter at that same closing price unless the rules explain how the order is placed before the close.
Common timing choices include:
Signal on today’s close, enter at next open.
Signal intraday, enter when a stop or limit is touched.
Signal at close, enter using a market-on-close order if the platform and market support it.
Be strict. If the strategy uses end-of-day data, assume the trade happens after that data is available.
Check the trade list, not just the equity curve
The equity curve is the headline, but the trade list reveals the mechanics. Review individual trades and confirm:
Entries match the written rules.
Exits trigger correctly.
Stops and targets use the right prices.
Position sizes change as intended.
No trades appear before an instrument existed.
No trades occur at prices outside the day’s range.
A strange trade list is a warning sign. Fix the logic before trusting the performance summary.
Track the metrics that show risk and quality
Profit alone is not enough. A strategy that made 40% with a 60% drawdown is very different from one that made 25% with a 10% drawdown. The goal is to understand both return and pain.
Use a clean tracking format for every test. Keep it consistent so different strategies and versions can be compared.
Metric | What it shows | How to read it |
Net profit | Total gain after costs | Useful, but weak without risk context |
Maximum drawdown | Largest peak-to-trough fall | Measures the worst historical pain |
Win rate | Percentage of winning trades | Needs average win and loss to mean anything |
Average win | Mean size of winning trades | Shows reward when right |
Average loss | Mean size of losing trades | Shows cost when wrong |
Profit factor | Gross profit divided by gross loss | Above 1 means gross gains exceeded gross losses |
Expectancy | Average expected result per trade | Combines win rate, wins, and losses |
Number of trades | Sample size | Low counts are less reliable |
Average holding period | Time in trade | Helps match strategy to capital and temperament |
Exposure | Time or capital committed | Shows how much risk was actually in the market |
Return to drawdown ratio | Net return divided by maximum drawdown | Helps compare return quality |
Profit factor is useful, but do not treat it as a magic number. A very high profit factor from a small sample can be less reliable than a moderate figure from hundreds of trades across different market conditions.
Win rate also needs context. A trend-following system may win less than half the time and still work if winners are much larger than losers. A mean-reversion system may win often but suffer occasional large losses. Neither profile is better by default. The question is whether the risk is acceptable and repeatable.
Use a version log as well:
Version | Change made | Test period | Reason for change | Result |
V1 | Original rules | 2014 to 2023 | Initial test | Baseline |
V2 | Added volatility filter | 2014 to 2023 | Reduce chop | Compare with V1 |
V3 | Changed exit length | 2014 to 2023 | Improve drawdown | Check out-of-sample |
This record stops “strategy drift”, where many tiny changes create a final system that no longer resembles the original idea.

Avoid the errors that make backtests lie
Most bad backtests fail for the same reasons. The strategy may not be the problem. The test design may be giving false comfort.
Curve fitting makes the past look too perfect
Curve-fitting happens when a strategy is adjusted so closely to past data that it captures noise rather than a repeatable edge. It often appears after repeated testing of many parameters.
For example, a trader tests moving average lengths from 5 to 200 and finds that a 37-day average with a 123-day average produced the best result on one market over one period. That combination may have no real meaning. It may simply be the best fit to that historical sample.
Warning signs include:
Very specific parameter values with no clear logic.
Great performance on one instrument, poor performance elsewhere.
Strong in-sample results, weak out-of-sample results.
A small number of trades driving most of the profit.
Constant rule changes after every losing period.
Performance that depends on excluding awkward years.
To reduce curve-fitting, use simple rules, test across different market regimes, keep parameter ranges sensible, and prefer broad areas of performance over one perfect setting. If 40 to 60 days all work reasonably well, that is more convincing than one isolated best value.
Look-ahead bias uses information that was not available
Look-ahead bias occurs when a backtest uses future information to make a past decision. It can be obvious or subtle.
Common examples include:
Entering at today’s close using a signal that requires today’s close.
Using revised economic data as if it was known at the time.
Ranking shares using financial statement data before it was released.
Using the day’s high or low to decide whether a trade should have been entered earlier that same day.
Building a universe from today’s index members and testing it historically.
The fix is simple in principle: every decision must use only data available at that date and time. In practice, this requires careful coding and good data handling.
Survivorship bias removes the failures
Survivorship bias appears when the test only includes instruments that still exist. If a share was delisted, merged, or went bust, it may disappear from the dataset. That makes the past look safer than it was.
This is common in share strategies. Testing only current index members over a long history can overstate returns because weaker past members are missing.
Use survivorship-bias-free data where possible. If that is not available, be cautious with conclusions.
Data quality errors distort signals
Historical data can include missing candles, bad ticks, split errors, dividend adjustments, timezone issues, and incorrect highs or lows. One bad price can trigger a false trade or inflate results.
Before trusting a backtest:
Inspect price charts around large wins and losses.
Check for corporate action adjustments.
Compare suspicious prices with another data source.
Confirm timezone alignment for multi-market strategies.
Remove or correct clear errors, but document the change.
Ignoring liquidity creates impossible trades
A strategy may look profitable on small or illiquid instruments, but the trade size may be unrealistic. If the system assumes it can buy or sell at the recorded price without moving the market, results may be overstated.
Add liquidity filters such as minimum average volume, maximum position size as a share of daily volume, and realistic slippage assumptions.

Decide whether the strategy is ready for real capital
A backtest should not end with excitement. It should end with a decision.
Ask these questions before risking money:
Does the strategy have fixed rules?
Did the backtest include realistic costs?
Was there a clean out-of-sample test?
Is the number of trades large enough to trust?
Did performance survive different market regimes?
Is the drawdown acceptable in real life?
Are the worst trades explainable?
Can the strategy be executed with the planned account size?
Does the edge remain after slippage and errors?
Has it been forward tested?
A sensible next step is a paper trade or very small live test. This checks execution, platform behaviour, spreads, order handling, and emotional pressure. Live conditions often reveal issues that historical testing misses.
Backtesting is not proof that a strategy will make money. It is a way to reject weak ideas, understand risk, and prepare for uncertainty. The value comes from the process: clear rules, honest data, realistic assumptions, and careful records.
The best backtest is not the one with the smoothest equity curve. It is the one that survives scrutiny and still looks tradeable after costs, drawdowns, mistakes, and unseen data.


Comments